
Monday, 26 July 2010
Minor Updates to NaPTAN System
There have been a few minor updates to the NaPTAN system. First we have re-ordered the warnings to make the manual warnings more prominent. This will help users discover and rectify manual warnings in their area. We have also made the ATCO Code and Nat Gaz ID more prominent on the feature pages to help when comparing NaPTAN with other systems.
Friday, 23 July 2010
New OpenStreetMap Analysis service launched
ITO have released a new OSM Analysis service that gives an overview of OpenStreetMap completeness for Great Britain when compared to the Ordnance Survey's OS Locator product.
The results can be viewed both on a map and as a summary report; the map highlights discrepancies between the sources and the summary gives headline figures for each of the 400+ district/boroughs in Great Britain. The summary reports use OS Boundary-Line.
The service will be useful both to volunteer mappers who wish to improve the OpenStreetMap in their area and also to end-users who wish to know how good the data is for a particular area.
Here is the map view:

And here is part of the summary report which can be sorted in various ways.

If errors are found in the Ordnance Survey's data by a mapper, which do sometimes occur, then the special 'not:name' field in OpenStreetMap can be used to report this and the discrepancy will no longer appear in the above reports and mapping.
Information in the 'not:name' field can also be used by the Ordnance Survey to help them improve their data quality by giving them an addition source of possible errors to check.
This service has been developed by ITO with support from Ideas in Transit which is a 5 year research project funded by the UK Government in which both ITO and the Ordnance Survey are partners.
This service would not have been possibly prior to the release of the Ordnance Survey datasets as open data in April 2010.
Free registration is required for access to the mapping view.
Monday, 31 May 2010
OS Locator validation mapping for UK OpenStreetMap data
ITO have produced a mapping layer which can be used within OpenStreetMap editors to check for differences between OpenStreetMap data and Ordnance Survey Locator (which has been released as Open Data).
Within the OpenStreetMap editor the new layer appears as a series of boxes with associated names for all streets that are in OS Locator but which are not in OSM within the same bounding box with a small buffer area added.
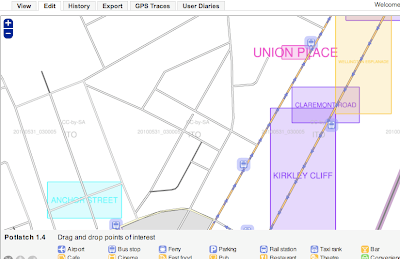
Normally a box in this layer indicates an error or omission in OSM, however there are also some errors in the OS data. The not:name can be added to the OSM data in these situations and the box will not appear in subsequent analyses and there is less risk that someone transcribing incorrect OS data into OSM at a later date.
An example of an error in OS Locator is the mispelling of Arthur's Terrace in Ipswich has been entered as 'Athurs Terrace'. I have added a tag 'not:name=Athurs Terrace' to the street and it now on longer shows on the analysis.
How many errors are there in OS Locator? I have been through data for Ipswich and have found 7 errors where OS Locator data does not match the relevant street sign. I have added not:name tags to all of these, follow the links to see how they work. It is also useful to add a 'note' field with a description of why the not:name tag has been added.
To access the above mapping from Potlatch add the following string of text into the 'custom' layer box.
http://tiles.itoworld.com/os_locator/!/!/!.png
As a technique I would recommend doing a first pass getting rid of the bigger and the less complicated boxes and then do a second pass on the remaining smaller ones as it can be difficult to make sense of multiple overlapping boxes in one pass.
The analysis is current run each night based on the Geofabrik GB data published earlier the same day so changes to OSM will show up in the map rendering not the next day but the day after that. You may therefor choose to do a pass across an area one day and then do a second pass a couple of days later.
Also, do note that the OS bounding boxes seem to have a small rounding error resulting in edges of the bounding box that do not always exactly match the end of the relevant street.
Within the OpenStreetMap editor the new layer appears as a series of boxes with associated names for all streets that are in OS Locator but which are not in OSM within the same bounding box with a small buffer area added.

Normally a box in this layer indicates an error or omission in OSM, however there are also some errors in the OS data. The not:name can be added to the OSM data in these situations and the box will not appear in subsequent analyses and there is less risk that someone transcribing incorrect OS data into OSM at a later date.
An example of an error in OS Locator is the mispelling of Arthur's Terrace in Ipswich has been entered as 'Athurs Terrace'. I have added a tag 'not:name=Athurs Terrace' to the street and it now on longer shows on the analysis.
How many errors are there in OS Locator? I have been through data for Ipswich and have found 7 errors where OS Locator data does not match the relevant street sign. I have added not:name tags to all of these, follow the links to see how they work. It is also useful to add a 'note' field with a description of why the not:name tag has been added.
- Berry Road (should be Belfry Road)
- Gwendoline Road (should be Gwendoline Close)
- Lagonda Drlve (the 'i' in Drive has been replaced with a '1')
- The Garrods (should be Garrards)
- Inglelow Gardens (should be Ingelow Gardens)
- Athurs Terrace (should be Arthur's Terrance)
- Fen Bright Circle (it is actually Fen Bight Circles)
To access the above mapping from Potlatch add the following string of text into the 'custom' layer box.
http://tiles.itoworld.com/os_locator/!/!/!.png
As a technique I would recommend doing a first pass getting rid of the bigger and the less complicated boxes and then do a second pass on the remaining smaller ones as it can be difficult to make sense of multiple overlapping boxes in one pass.
The analysis is current run each night based on the Geofabrik GB data published earlier the same day so changes to OSM will show up in the map rendering not the next day but the day after that. You may therefor choose to do a pass across an area one day and then do a second pass a couple of days later.
Also, do note that the OS bounding boxes seem to have a small rounding error resulting in edges of the bounding box that do not always exactly match the end of the relevant street.
Saturday, 1 May 2010
'Airspace rebooted' animation hits 500,000 viewings
Only a week after ITO World Ltd published an animation showing flight movements over Europe in the period after the 2010 eruptions of Eyjafjallajökull the online plays have hit 500,000. We have had mentions in the online versions of the Economist, the Guardian and the Huffington Post and it was shown on Canada's Discovery television channel.

From 20 April 2010 flights were pretty much back to normal (note that there is still no data for much of France and for some other parts of Europe).

As well as our original animation which we released using a creative commons share -alike license there is now a version set to music and one with an ash cloud overlay.
ITO World are experts at transport data presentation and Open Data. We have produced an animation for Sir Tim Berners Lee which he showed at TED of edits to OpenStreetMap during 2009 and our 'OSM 2008: A Year of Edits' animation has been viewed 145,000 times online and shown at numerous conferences.
ITO have also been documenting the creative ways people used social media to get home after the flight disruptions as part of Ideas in Transit.
Airspace Rebooted from ItoWorld on Vimeo.
The animation is based on information collected by volunteers of the FlightRadar24 project who use VHF receivers to gather data from transmission from commercial planes. The base mapping is from OpenStreetMap.
On 17 April 2010 there were virtually no flights:
By 18 April 2010 there were a few more:
By 19 April 2010 there were more flights over mainland Europe but still none from United Kingdom airports:

From 20 April 2010 flights were pretty much back to normal (note that there is still no data for much of France and for some other parts of Europe).

As well as our original animation which we released using a creative commons share -alike license there is now a version set to music and one with an ash cloud overlay.
ITO World are experts at transport data presentation and Open Data. We have produced an animation for Sir Tim Berners Lee which he showed at TED of edits to OpenStreetMap during 2009 and our 'OSM 2008: A Year of Edits' animation has been viewed 145,000 times online and shown at numerous conferences.
ITO have also been documenting the creative ways people used social media to get home after the flight disruptions as part of Ideas in Transit.
Tuesday, 27 April 2010
Metric Downloads and Test Adjustments
ITO has released a new version of the NaPTAN Management service which provides a number of new features.
Metric Downloads
There is a now a new Metrics Download Page where users can download in CSV format a number of different Metrics. It is possible to download counts of live, suppressed or resolved warnings for any scope for any date to get a snapshot of where the system was at any point. The system can also provide trend information to monitor warning types over a given period and establish how the system is performing over time.
New Tests and Test Adjustments
A new test has been added called "Stop Indicator Not Preferred". This tests whether the Stop Indicator is one of the new preferred list of indicators that should be used. Other tests have also been tightened to help keep the NaPTAN dataset continually improving.
A number of other minor features and bug fixes have been added to help improve the service.
Tuesday, 6 April 2010
BBC Interview: Ordnance Survey and Transport Open Data

As Making Public Data Public gathers momentum in government, the focus is now moving to the need for open transport data in the UK. I was interviewed by the BBC about the Ordnance Survey open data release and took the opportunity to talk about "the missing link", that is transport schedule data.
It starts about 30 seconds in:
Download BBC Pods and Blogs post
Follow @radioproducer the intrepid BBC broadcaster
Wednesday, 31 March 2010
TED, Tim Berners-Lee & ITO - The Video
Its taken a little while for us to publish this, but I'm sure you will agree it was worth the wait. Here is Tim Berners-Lee showing off some of our visualisation magic at this year's TED conference in "The Year Open Data Went Worldwide":
Now that's story telling with data.
Now that's story telling with data.
Subscribe to:
Posts (Atom)

