We have produced an animation of edits made to OpenStreetMap around the world in 2008.
OSM 2008: A Year of Edits from ItoWorld on Vimeo.
OpenStreetMap is a wiki-style map of the world and this animation produces a flash of white each time a new way is entered or when an existing way is updated. Some edits are a result of a physical local survey by someone with a GPS unit, other edits will have been done remotely using aerial photography or out-of-copyright maps. Others are based on bulk imports of official or commercial datasets that are available using a suitable 'share-alike' licence.
OpenStreetMap started in 2004 and the rate of contributions has been accelerating with four times as many people contributing to the project in 2008 compared to 2007 and with bulk imports of data for the Belarus, India, Italy, USA and for many other places.
Supporting OpenStreetMap is an important part of ITO's business which is focused on providing high-quality on-line transport and mapping services to both organisations and individuals in the UK and around the world.
We also post still images on Flickr.
Wednesday, 31 December 2008
Friday, 12 December 2008
Major NaPTAN Upgrade and Other Improvements
We are doing a major site upgrade this weekend. Hopefully, we will only be offline for about five minutes on Friday evening 12th December and should then be back with some new functionality. We are upgrading the main ITO website, making significant improvements to the NaPTAN product, and adding some minor fixes to the OSM Mapper product. There are also a number of behind the scenes changes that make improvements in the future easier.
NaPTAN
The NaPTAN product is a free online service for UK transport professionals involved in the management of the NaPTAN dataset which is a database of all the points of access to the UK public transport network. New users can request a subscription through our website. We perform tests on this data on a daily basis and allow users to see what is current in the dataset. We have improved a number of these tests as well as added some new ones.
We have introduced a 'manual warning' feature where users can flag an error for features (such as a bus stop or a locality) for which they believe the information given is wrong. The 'warning' consists of a text description field and this information will then appear in reports for the relevant data owners and managers. Other users can then update the issue as 'resolved' if they have fixed the associated problem or as 'suppressed' if they believe the fault report is in error.
We have added new tests to check the information used to snap on-street stops to roads. This information is important when presenting bus stops on maps that show where to access services. We now report on bus stops where the street name given in NaPTAN dataset does not match any nearby streets in the roads dataset and also where the bearing in the NaPTAN dataset does not match either of the directions of travel away from the bus stop along the selected road (for example where the bus stop says that buses leave to the north but the road of the appropriate name runs east-west).
We now import all the data associated with Hail and Ride stop points and display the relevant information on the Stop Point page.
We are testing the locality+qualifier to spot non-unique combinations in the UK to ensure that ambiguous locality names (such as Cambridge) have a qualifier (eg Cambridgeshire or Gloucestershire).
We have provided a link to OpenStreetMap as well as to Google Maps and Multimap etc from the 'view' menu on maps and this can sometimes be a useful alternative source of mapping data. In some places the data is still incomplete, but in other areas it is more up-to-date than the information available from commercial sources.
NPTDR 2008
We are currently working closely with the Department for Transport, Traveline and Thales on the 2008 release of the NPTDR dataset which contains details of all public transport movements in the UK. We are currently testing this database of 1.3 million public transport journeys against some thirty quality checks on a daily basis.
Although this product is now moving to our production servers, it will initially only be available to a small number of subscribers who are directly involved in the preparation of the data. We expect to be able to make this product available to all NaPTAN users as soon as the data is officially released.
Other Improvements
We have updated the website with new graphics on our home page and each product now identifies who has sponsored it.
We have added a messaging system so we can warn our users of planned downtime or current issues with the system. These messages will appear in the top bar if they are applicable.
We have hopefully resolved the issue with RSS feeds for users who are not logged in which was affecting OSM Mapper users and possibly also other users.
Saturday, 25 October 2008
OSM Mapper Now Available for the USA
OSM Mapper is now available for the United States (and everywhere else). To find out more about OSM Mapper read our initial blog entry. Take a look at where work is being done across the USA. In the image below the bright spots show areas with recent edits and the background colours show when the main TIGER data was imported.

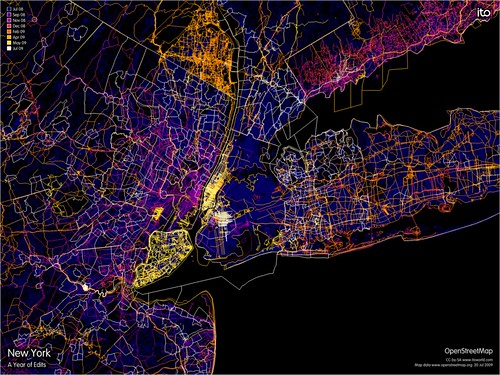
Looking more closely you can see a lot of activity in New York:
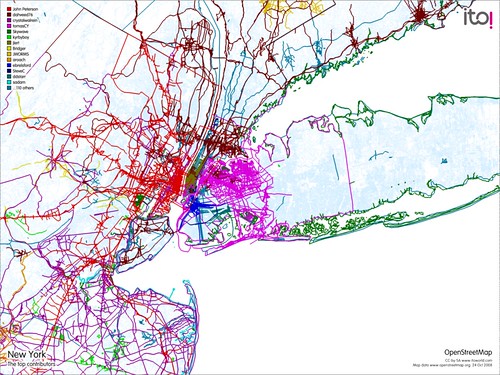
It is also possible to see who has actually been doing the work (click on any image to access a more detailed version):
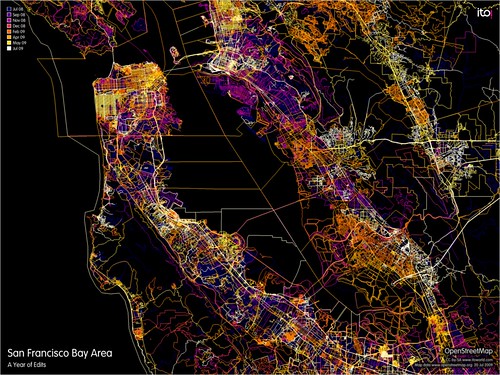
Across on the West Coast there has also been a lot of work in the Bay Area:
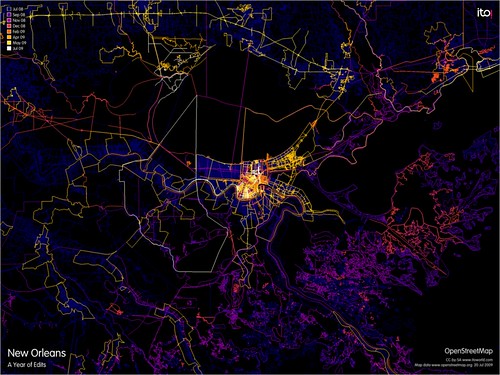
Around New Orleans:
And many other places. Why not subscribe for free and find out what is happening your area?
This product was developed with support from Ideas in Transit.

Looking more closely you can see a lot of activity in New York:

It is also possible to see who has actually been doing the work (click on any image to access a more detailed version):

Across on the West Coast there has also been a lot of work in the Bay Area:

Around New Orleans:

And many other places. Why not subscribe for free and find out what is happening your area?
This product was developed with support from Ideas in Transit.
Friday, 29 August 2008
Expanded Coverage for OSM Mapper
OSM Mapper coverage has now been extended to include Africa, the Middle East, Asia, Australasia, South America and Canada. The only area still missing is the USA which will be added at the next stage.
OSM Mapper is a product (free to use after registration) that allows users to analyse and view data for areas of interest, but until now coverage has been limited to Europe. To find out more about the product's features, see the original announcement.
Here is an image showing nice team-work in Melbourne, Australia.

The following images show examples of recent activity around the world. Please note that currently only ITO staff can create such wide-area images.
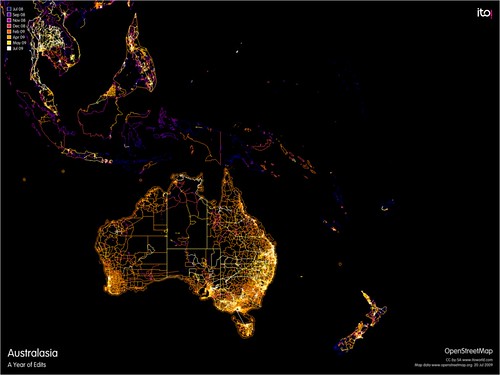
Zooming out from Melbourne we can see where there has been recent activity across Australasia.
Head north and see what been happening in Japan, parts of China and North and South Korea.

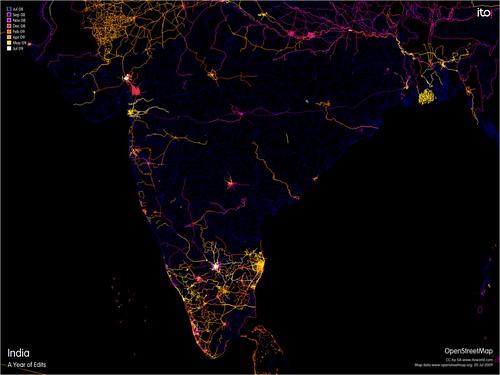
Moving west we can see what is going on in India. The big bulk upload of trunk roads arrived in February 2008, courtesy of Automotive Navigation Data. Since then there have been some busy areas, possibly due to the series of mapping parties held in India.
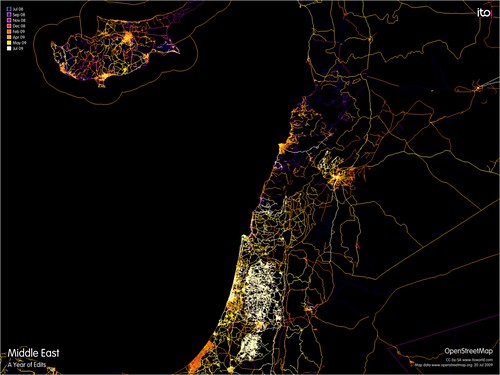
Moving further west we can see activity across Cyprus, Lebanon, Israel, Egypt and Palestine with a lot of progress in the past few months.
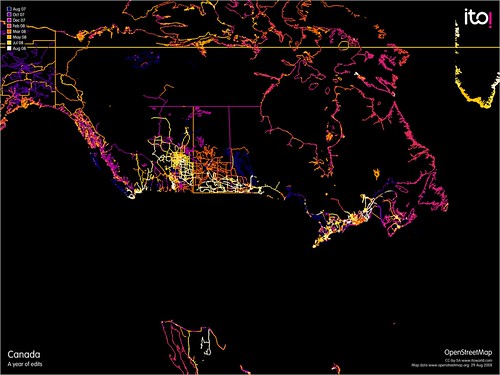
Skipping existing coverage in Europe, we can see Canada - with lots of activity in the more densely populated South.
Heading down to South America, we can see that clearly some areas are doing a lot of work.

Finally, if the place you are really interested in is the USA then subscribe to this blog and we will post here as soon as we are set up to handle all the TIGER data.
If you want to find out more about the product and how to subscribe or use it then read our original announcement.
We would like to thank Geofabrik for providing free access to their daily version of the OSM datafile.
This product was developed with support from Ideas in Transit, a five-year research project following user-led information technology innovation in the transport domain funded by the UK Department for Transport, the Technology Strategy Board and the Engineering and Physical Sciences Research Council.
OSM Mapper is a product (free to use after registration) that allows users to analyse and view data for areas of interest, but until now coverage has been limited to Europe. To find out more about the product's features, see the original announcement.
Here is an image showing nice team-work in Melbourne, Australia.

The following images show examples of recent activity around the world. Please note that currently only ITO staff can create such wide-area images.
Zooming out from Melbourne we can see where there has been recent activity across Australasia.

Head north and see what been happening in Japan, parts of China and North and South Korea.

Moving west we can see what is going on in India. The big bulk upload of trunk roads arrived in February 2008, courtesy of Automotive Navigation Data. Since then there have been some busy areas, possibly due to the series of mapping parties held in India.

Moving further west we can see activity across Cyprus, Lebanon, Israel, Egypt and Palestine with a lot of progress in the past few months.

Skipping existing coverage in Europe, we can see Canada - with lots of activity in the more densely populated South.

Heading down to South America, we can see that clearly some areas are doing a lot of work.

Finally, if the place you are really interested in is the USA then subscribe to this blog and we will post here as soon as we are set up to handle all the TIGER data.
If you want to find out more about the product and how to subscribe or use it then read our original announcement.
We would like to thank Geofabrik for providing free access to their daily version of the OSM datafile.
This product was developed with support from Ideas in Transit, a five-year research project following user-led information technology innovation in the transport domain funded by the UK Department for Transport, the Technology Strategy Board and the Engineering and Physical Sciences Research Council.
Thursday, 17 July 2008
'OSM Mapper' for OpenStreetMap Contributors
I am just back from the amazing second State of the Map Conference in Limerick at the weekend where we showed our new free product, OSM Mapper, that allows contributors to OpenStreetMap to monitor and improve the quality of data in their areas. We got the conference delegates to try it out and they seemed to be pleased. The few initial snags are now resolved and the servers are holding up well so it is time to open it up more widely.
Since the conference we have expanded the area available from the UK to the whole of Europe, and have moved from a weekly to a daily update. The next challenge is worldwide coverage which we will do as soon as we are confident with Europe. Btw, the new version of Potlatch that went live today means that it is now possible to click on the 'Potlatch' link from ITO Mapper and enter Potlatch with the relevant feature already selected.
Using this product you can set up one or more areas to monitor and analyse in a variety of ways. You can even establish RSS feeds to get alerts when other people make changes within areas of interest. You can also generate beautiful images to download and post anywhere as (CC-by-SA).
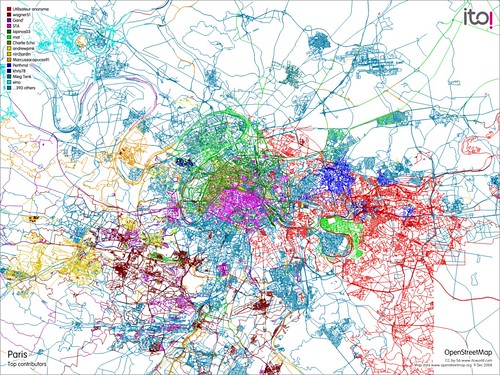
You can show the main contributors to the map using a view colour-coded by contributor. This image shows the top contributors in the Paris area.
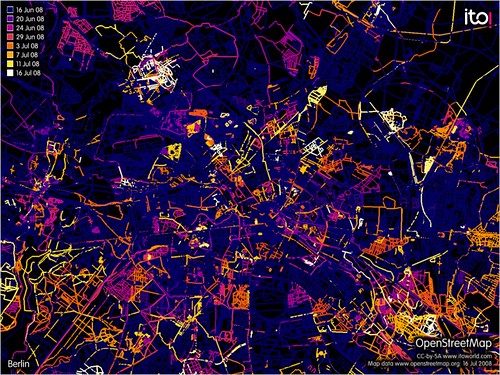
You can also see how long it has been since different parts of an area have been modified over various time frames. The next image shows changes in Berlin in the past month.
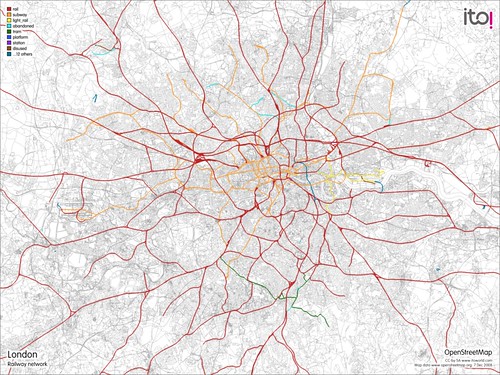
You can focus on a particular aspect of the data, eg railways, waterways, schools etc. This map shows the various railway systems in London.
You can subscribe to an RSS feed for recent changes to railways in London. As the feed contains GeoRSS data, you can also view the feed in an appropriate viewer like Google Maps.
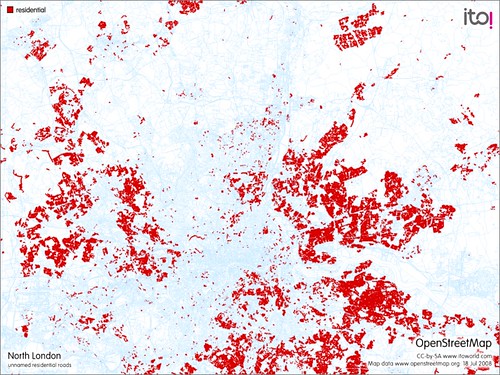
With filters, you can select features that are missing data. For example, this image shows a breakdown of unnamed residential roads in North London.
You can check for changes in an area by other people. This image below shows edits made in Ipswich by people other than PeterIto.

An RSS feed is also available to monitor the area above for changes by people other than PeterIto.
This image shows where we currently offer coverage (and also shows recent edits in the area).

Why not subscribe to our product, check out a tutorial slide presentation, or look at various images on Flickr?
There are a number of current limitations that will removed in due course: The coverage is Europe only. There is an size limit when selecting areas; this is large enough to cover most European cities - however the ability to generate images of very large areas, such as whole countries, is restricted due to the high processing times involved. Updates are normally daily and are unlikely to become more frequent just yet. It doesn't pay any attention to point features, only ways, so it is good for analysing roads and parks etc but not letter boxes and bicycle parks. We intend to offer functionality to allow people to share areas; you can do that now by sharing URLs, but we will implement a more formal approach in due course. Finally, deleted features are not picked up in the RSS feeds so you won't be warned if someone has deleted a feature, however big it is! Stay tuned to this blog for information about future enhancements.
Please give us feedback by commenting on this post, using the comment link at the bottom of each page in the product, or emailing support 'at' itoworld.com.
Since the conference we have expanded the area available from the UK to the whole of Europe, and have moved from a weekly to a daily update. The next challenge is worldwide coverage which we will do as soon as we are confident with Europe. Btw, the new version of Potlatch that went live today means that it is now possible to click on the 'Potlatch' link from ITO Mapper and enter Potlatch with the relevant feature already selected.
Using this product you can set up one or more areas to monitor and analyse in a variety of ways. You can even establish RSS feeds to get alerts when other people make changes within areas of interest. You can also generate beautiful images to download and post anywhere as (CC-by-SA).
You can show the main contributors to the map using a view colour-coded by contributor. This image shows the top contributors in the Paris area.

You can also see how long it has been since different parts of an area have been modified over various time frames. The next image shows changes in Berlin in the past month.

You can focus on a particular aspect of the data, eg railways, waterways, schools etc. This map shows the various railway systems in London.

You can subscribe to an RSS feed for recent changes to railways in London. As the feed contains GeoRSS data, you can also view the feed in an appropriate viewer like Google Maps.
With filters, you can select features that are missing data. For example, this image shows a breakdown of unnamed residential roads in North London.

You can check for changes in an area by other people. This image below shows edits made in Ipswich by people other than PeterIto.

An RSS feed is also available to monitor the area above for changes by people other than PeterIto.
This image shows where we currently offer coverage (and also shows recent edits in the area).

Why not subscribe to our product, check out a tutorial slide presentation, or look at various images on Flickr?
There are a number of current limitations that will removed in due course: The coverage is Europe only. There is an size limit when selecting areas; this is large enough to cover most European cities - however the ability to generate images of very large areas, such as whole countries, is restricted due to the high processing times involved. Updates are normally daily and are unlikely to become more frequent just yet. It doesn't pay any attention to point features, only ways, so it is good for analysing roads and parks etc but not letter boxes and bicycle parks. We intend to offer functionality to allow people to share areas; you can do that now by sharing URLs, but we will implement a more formal approach in due course. Finally, deleted features are not picked up in the RSS feeds so you won't be warned if someone has deleted a feature, however big it is! Stay tuned to this blog for information about future enhancements.
Please give us feedback by commenting on this post, using the comment link at the bottom of each page in the product, or emailing support 'at' itoworld.com.
Labels:
itoworld,
openstreetmap,
OSM Mapper,
state of the map
Tuesday, 27 May 2008
NaPTAN Management Product - Major Upgrade
At ITO, we have just added a lot of new functionality to our on-line NaPTAN management service.
Firstly we have added a 'product' bar at the top of the page which allows you to access your profile, to log out and to change which product you are accessing in preparation for the release of new products soon. In the near future we will be adding additional products and users will be able to switch between different products by clicking on the appropriate one on the left of the title bar.
Within NaPTAN we have added the ability for regional managers to add additional tests to the ones being tracked (warnings) from the list of observations. Regional managers will be enabling appropriate ones for their region after discussion with individual areas in the coming weeks.
We have opened up access to any person with a legitimate reason to use the NaPTAN product. To invite someone go to the 'NaPTAN' main page (by clicking on naptan in the left menu, or by clicking on NaPTAN in the product bar) and click on 'invite users'. Then just type in the user's email address and a brief introductory message. Legitimate users include council officers, contractors and volunteers who have a role to play improving NaPTAN data.
You can also now subscribe to a region or area summary page now using an RSS reader and we have added a 'watch' facility; click on the watch link at the top of locality, stop and other pages and it will create a link to the page from your main NaPTAN page.
We have also made some adjustments to some of the newer tests in response to feedback.
Subscribe to:
Comments (Atom)


