
OK, so we have installed our new servers and they are performing well so we have removed all the geographic restrictions from our new ITO Map service. This means that you can now check out waterways in Australia, schools in Berlin, electricity generation and supply in Japan or anything else that takes your fancy! We have also relaxed the zoom level restriction allowing you to zoom out to level 8 for all map overlays.
We released the services for the UK and parts of northern Europe on the 18th March and then extended to the USA and parts of Canada and the Caribbean on the 23rd March.
ITO Map has been developed with support from Ideas in Transit, a five-year UK research project following user-led information technology innovation in the transport domain with support from the UK Department for Transport and the Technology Strategy Board.
Wednesday, 30 March 2011
Wednesday, 23 March 2011
ITO Map extended to cover USA, Canada and the Caribbean
We have just extended coverage of our ITO Map overlay map service to most of the USA and Canada and all the Caribbean islands (ie all of the USA except Hawaii and Alaska and all of Canada except the northern wilderness). Read more on the ITO Map wiki page and in the earlier announcement accompanying the release for the UK and parts of Europe.
Users of the existing European service may notice that we have reduced the maximum zoom level for 8 to 10 for some scripts and increased it from 11 to 10 for some others. Further expansion of the service will come by the end of next week.
This first screenshot highlights lakes, rivers and ferry routes in British Columbia (lakes in light blue, rivers in dark blue, coastline in green, canals using tan and ferries in read). Click on any of these screenshots to open the browser for the given views. Keys are provided for all overlays in the bottom left corner of the map. Clicking on the key takes one to further details on the OSM wiki.

This next view is of railways in New York (Mainline services are in black, underground rail in red and light rail in blue).

This next one is for speed limits in Seattle (lowest speeds are green, higher speeds in purple and blue). Full details in the key.

And finally electricity distribution around Baltimore with sub stations in red, power distribution in various colours according to voltage and black where no voltage is specified.

Users of the existing European service may notice that we have reduced the maximum zoom level for 8 to 10 for some scripts and increased it from 11 to 10 for some others. Further expansion of the service will come by the end of next week.
This first screenshot highlights lakes, rivers and ferry routes in British Columbia (lakes in light blue, rivers in dark blue, coastline in green, canals using tan and ferries in read). Click on any of these screenshots to open the browser for the given views. Keys are provided for all overlays in the bottom left corner of the map. Clicking on the key takes one to further details on the OSM wiki.
This next view is of railways in New York (Mainline services are in black, underground rail in red and light rail in blue).
This next one is for speed limits in Seattle (lowest speeds are green, higher speeds in purple and blue). Full details in the key.
And finally electricity distribution around Baltimore with sub stations in red, power distribution in various colours according to voltage and black where no voltage is specified.
Friday, 18 March 2011
ITO Map - A new map overlay service for OpenStreetMap
ITO are pleased to announce ITO Map, a set of new overlay maps for OpenStreetMap that highlight data layers within OSM which are invisible using the standard map views; these include speed limits, highway lane widths, whether rivers are navigable and electricity distribution. The overlays available using this service are described in more detail on the ITO Map wiki page.
For the first few days we are providing the service for two areas, the first includes the UK, northern France, Holland, eastern Germany up to southern Norway; a separate area coveering the bay area around San Francisco is also included. We will roll out the service to more areas over the coming days with the intention of going global within a few weeks. All overlays have keys available at the bottom left and in addition these keys link to the wiki page for further details when clicked (or 'right clicked').
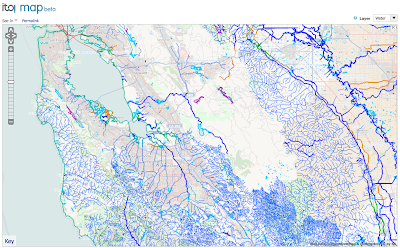
Here are examples from some of the 22 map views that are currently available. This first one shows water features around Bay Area in California. The colours are chosen to make a clear distinction between different feature types (rivers and streams are blue, canals are tan, lakes turquoise, reservoirs purple and the coast in green).
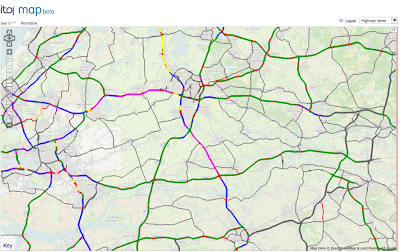
And this one shows the number of lanes for highways around Utrecht in Holland (dual 2 lane carriageways are shown in green, 3 lanes in blue, four lanes in purple and 6 lanes in yellow).
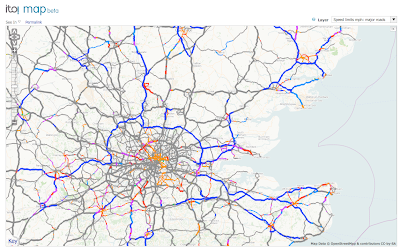
And road speed limits for major roads in the United Kingdom (70mph in dark blue, 60mph in light blue, 50mph in violet, 40mph in red and 30mph in orange).
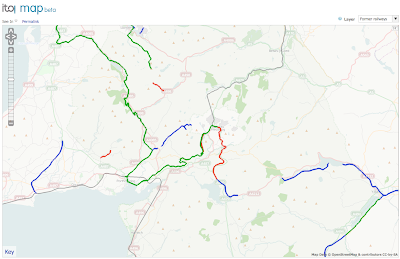
Former railways in north Wales (green for heritage lines, red for disused lines where the tracks still in place, blue for dismantled where the alignment is still in tact but the tracks have been lifted and violet for where there is no remaining evidence of the route).
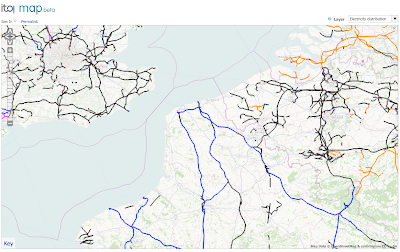
Electricity distribution in northern France and surrounding countries (dark blue for 400KV, purple for 320KV, orange for other high tension voltage and thin green lines for low voltage minor lines). Power generation plant and substations/transformers are also shown.
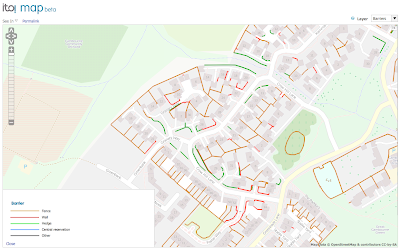
And finally some amazing 'micro-mapping' for Cambourne, Cambridgeshire detailing all the fences, hedges and walls in town (green for hedges, brown for fences and red for walls). I think this is a great example of how OpenStreetMap is going way beyond the place where commercial mapping stops.
The tiles will initially be based on daily diff planet data (which will normally be updated daily with a 24 hour processing lag). The service is likely to be slower after about 04:00 hours UTC when the new data is loaded. We are in the process of adding server capacity to improve performance further and allow a global release but wanted to get the service available for at least part of the world immediately. In the short term if the service is too slow then please give it a break for a hour or so and before trying again. The overlays can only display linear and area features at this stage, we will add the ability to handle nodes in due course. In time we will include overlays from other data sources as well as OpenStreetMap, hence the name 'ITO Map' rather than somthing which included OpenStreetMp or OSM in the title.
Do add comments and suggestions to the wiki page. We will gather feedback over the next week and iron out any wrinkles.
For the first few days we are providing the service for two areas, the first includes the UK, northern France, Holland, eastern Germany up to southern Norway; a separate area coveering the bay area around San Francisco is also included. We will roll out the service to more areas over the coming days with the intention of going global within a few weeks. All overlays have keys available at the bottom left and in addition these keys link to the wiki page for further details when clicked (or 'right clicked').
Here are examples from some of the 22 map views that are currently available. This first one shows water features around Bay Area in California. The colours are chosen to make a clear distinction between different feature types (rivers and streams are blue, canals are tan, lakes turquoise, reservoirs purple and the coast in green).
And this one shows the number of lanes for highways around Utrecht in Holland (dual 2 lane carriageways are shown in green, 3 lanes in blue, four lanes in purple and 6 lanes in yellow).
And road speed limits for major roads in the United Kingdom (70mph in dark blue, 60mph in light blue, 50mph in violet, 40mph in red and 30mph in orange).
Former railways in north Wales (green for heritage lines, red for disused lines where the tracks still in place, blue for dismantled where the alignment is still in tact but the tracks have been lifted and violet for where there is no remaining evidence of the route).
Electricity distribution in northern France and surrounding countries (dark blue for 400KV, purple for 320KV, orange for other high tension voltage and thin green lines for low voltage minor lines). Power generation plant and substations/transformers are also shown.
And finally some amazing 'micro-mapping' for Cambourne, Cambridgeshire detailing all the fences, hedges and walls in town (green for hedges, brown for fences and red for walls). I think this is a great example of how OpenStreetMap is going way beyond the place where commercial mapping stops.
The tiles will initially be based on daily diff planet data (which will normally be updated daily with a 24 hour processing lag). The service is likely to be slower after about 04:00 hours UTC when the new data is loaded. We are in the process of adding server capacity to improve performance further and allow a global release but wanted to get the service available for at least part of the world immediately. In the short term if the service is too slow then please give it a break for a hour or so and before trying again. The overlays can only display linear and area features at this stage, we will add the ability to handle nodes in due course. In time we will include overlays from other data sources as well as OpenStreetMap, hence the name 'ITO Map' rather than somthing which included OpenStreetMp or OSM in the title.
Do add comments and suggestions to the wiki page. We will gather feedback over the next week and iron out any wrinkles.
Subscribe to:
Posts (Atom)

