As Making Public Data Public gathers momentum in government, the focus is now moving to the need for open transport data in the UK. I was interviewed by the BBC about the Ordnance Survey open data release and took the opportunity to talk about "the missing link", that is transport schedule data.
Its taken a little while for us to publish this, but I'm sure you will agree it was worth the wait. Here is Tim Berners-Lee showing off some of our visualisation magic at this year's TED conference in "The Year Open Data Went Worldwide":
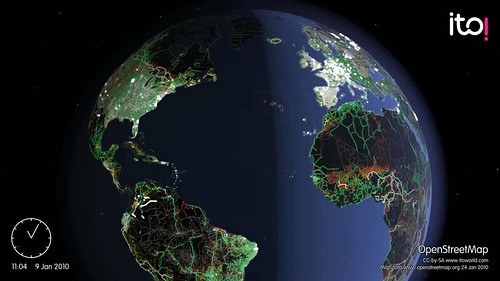
As some of you have noticed, OSM Mapper isn't updating right now. Why you may ask? Well the OSM planet file was broken for a week, which is essential so we couldn't do much about that, and take a look at this:
Thanks to the growth of the OSM community, the data is growing exponentially. We are amazed and delighted by this growth, but it does give us some development challenges with our global OSM model. We've taken the down-time as an opportunity to take a look at how we process OSM data.
Fear not, Hal is working on our new and improved global OSM model. We'll let you know when the new model is in operation and OSM Mapper is updating again.
We are proud to announce that our work has been displayed at this year's TED conference, where the world's greatest thinkers and doers come together. We were asked to provide visualisations that helped tell the story of open data in 2009, for Sir Tim Berners-Lee to give an update on open data since his talk last year.
We chose to tell the story of 'OpenStreetMap - Project Haiti'.
We all followed the crisis that unfolded following the Haiti earthquake, many of us chose to donate money, a few were flown out and deployed as part of the relief effort. But what practical impact can many have without being there in Haiti itself? Well, during this crisis a remarkable story unfolded; of how people around the world could virtually collaborate and contribute to the on-the-ground operations.
With the little existing physical, political and social infrastructure now destroyed or damaged, the situation was especially challenging for aid agencies arriving on the ground. Where are the areas most in need of assistance, how do we get there, where are people trapped under buildings, which roads are blocked? This information is important to the rescue agencies immediately after the event, and to the longer rebuilding process. In many developing countries, there is a lack of good mapping data and particularly after a crisis, when up-to-date information is critical to managing events as they evolve.
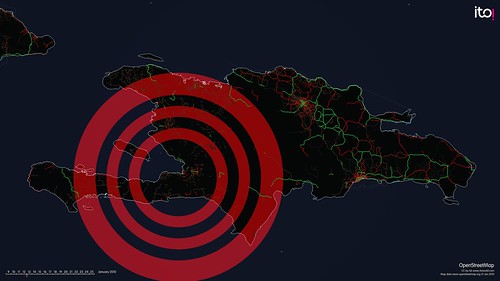
Enter OpenStreetMap, the wiki map of the world, CrisisMappers and an impromptu community of volunteers who collaborated to produce the most authoritative map of Haiti in existence. Within hours of the event people were adding detail to the map, but on January 14th high resolution sattelite imagery of Haiti was made freely available and the Crisis Mapping community were able to trace roads, damaged buildings, and enter camps of displaced people into OpenStreetMap. This is the story of OpenStreetMap - Project Haiti:
Each flash represents a new edit into OpenStreetMap, and this visualisation is a vivid picture of how much work was contributed by volunteers, following the quake. First the primary and secondary roads (green and red) are added and then smaller residential streets and many other features such as the blue glowing camps of displaced people that emerge.
Its not all about OpenStreetMap however, a variety of organisations provided technical solutions with vital services, such as Ushahidi - a service where anyone in Haiti can send an SMS message with their location and report an emergency or need. All this information is then aggregated and publicly displayed in near real-time, on a platform that almost anyone can use.
With all the talk of open data and the launch of Data.gov.uk, its very easy for us to get excited about the release of huge tranches of government data, but means little to anyone else. We now have the potential for many new services that will bring tangible benefits, in this case for the crisis management of the Haiti Earthquake. After the crisis, thousands of people from all over the world were able to contribute and build what is now the most complete map of Haiti - in use on the ground by the United Nations, Ushahidi, and the default map of choice for NGOs. This picture says it all:
OpenStreetMap being used on a GPS unit for search and rescue in Haiti by Fairfax County Urban Search & Rescue Team
What does all this have to do with ITO World and transport? Well, we want to visualise and tell the story of transport - how does the network function, what is the story of your commute, how will this planning decision affect transport in my city? We are working on powerful analytical tools that will visualise the current status, and future scenarios of transport networks enabling us to make better decisions. By creating a narrative around transport, people can understand how and why decisions are being made, and collaborate to build a better transport system that meets their needs.






 Posts
Posts


